Global buyers are rethinking energy procurement as climate risks, fuel volatility, and grid pressure increase. Sustainable energy sources now influence factory investment, product pricing, and long-term supply security. According to the International Renewable Energy Agency’s Renewable Capacity Statistics 2024, renewables added approximately 473 gigawatts of global power capacity in 2023. They represented about 86% of total new capacity. This growth is impressive, but capacity alone does not guarantee reliable energy access.
This guide examines ten sustainable energy sources for international buyers, including solar, wind, hydropower, geothermal energy, biomass, and emerging marine technologies. Each option has different costs, operating conditions, land requirements, and development risks. The International Energy Agency’s World Energy Outlook 2024 indicates that global clean-energy investment is approaching two trillion dollars annually. However, buyers should not treat investment volume as proof of universal suitability. A solar project may perform well in a dry region but struggle with dust, weak transmission lines, or limited storage. Wind turbines can deliver strong output, yet permitting, local acceptance, and maintenance access remain practical concerns.
Real procurement decisions require more than headline prices. Buyers should review lifecycle emissions, equipment warranties, supplier experience, grid stability, financing terms, and end-of-life management. The Levelized Cost of Energy can help, but it may overlook balancing costs and extreme-weather exposure. That limitation matters. No ranking is universally correct. This overview therefore combines industry data with practical purchasing considerations, while acknowledging that technology forecasts can change faster than contracts. Careful due diligence remains essential for credible, resilient, and genuinely sustainable energy sourcing.
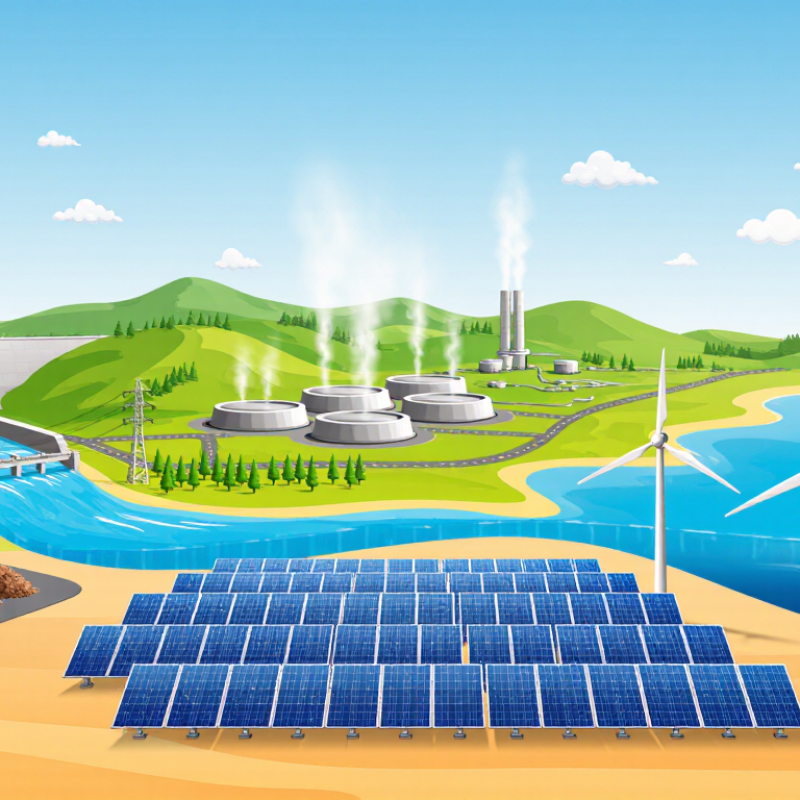
For global buyers, sustainable energy means more than choosing a renewable label. It means supplying reliable energy while reducing lifecycle emissions, resource pressure, and social harm. The IPCC estimates lifecycle emissions near 820 grams of CO2 equivalent per kilowatt-hour for coal, compared with about 11 grams for wind and 41 grams for solar. These figures provide useful direction. They do not tell the whole story.
A responsible buyer should examine project location, grid conditions, water use, materials, labor practices, and end-of-life plans. IRENA reported that 81% of utility-scale renewable projects commissioned in 2023 generated electricity below the cost of the cheapest new fossil-fuel alternatives. Affordability is improving. Reliability still varies. A solar project may produce strongly at noon but offer little power after sunset. Buyers may need storage, flexible demand, or firm generation.
The IEA reported roughly 510 gigawatts of renewable capacity additions in 2023, showing rapid market expansion. Yet rapid growth can create rushed procurement and weak supply-chain checks. A low-carbon claim can hide difficult impacts. Check the details. Global buyers should request lifecycle assessments, verified production data, grid emissions factors, and clear evidence of worker protections. Certification helps, but it is not perfect. Buyers also need to question whether an energy contract delivers additional clean generation or merely reallocates existing output. Sustainable energy is therefore a measurable performance standard, not a decorative label.
Solar and wind power are scalable options for buyers serving very different markets. Solar projects can fit rooftops, factory grounds, parking areas, and remote microgrids. A commercial buyer should review sunlight levels, roof strength, land access, and grid reliability before choosing capacity. A sunny location helps, but heat, dust, and seasonal clouds still affect output.
Wind power suits coastal zones, open plains, and elevated sites with steady air movement. However, average wind speed alone is not enough. Developers need long-term measurements, turbine spacing studies, transport plans, and community feedback. A windy map can look promising. The project may still face noise concerns, difficult roads, or expensive grid connections.
Practical procurement also includes storage, spare parts, warranties, and local technicians. Batteries can support evening demand when solar production falls. Wind systems may produce more power at night, but their output remains variable. Buyers should compare lifetime costs rather than equipment prices alone. Material use, recycling routes, and maintenance travel deserve attention too. The numbers are not always clean. Forecasts can miss weather extremes, and our own assumptions may be too optimistic. A phased installation, with measured performance after each stage, often gives diverse markets more control and fewer costly surprises.
| Energy source | Indicative capacity factor | Indicative global LCOE (USD/MWh) | Key advantages | Main considerations and suitable markets |
|---|---|---|---|---|
| Solar photovoltaic (PV) | About 10–25% | 44 (2023 global weighted average) | Modular and quick to deploy; works at utility scale, on rooftops, and in off-grid systems. | Output varies with daylight, weather, and season. Well suited to sunny regions and distributed generation; storage or grid flexibility can help balance output. |
| Onshore wind | About 25–45% | 33 (2023 global weighted average) | Mature, scalable technology with competitive costs at strong wind sites. | Requires suitable wind resources, grid access, and careful siting. A strong option for inland areas with consistent winds. |
| Offshore wind | About 35–60% | 75 (2023 global weighted average) | Often benefits from stronger, steadier winds and can serve major coastal demand centres. | High upfront investment and complex marine construction and grid connections. Best suited to coastal markets with suitable seabed and ports. |
| Hydropower | About 30–60%; varies by plant and water availability | 57 (2023 global weighted average) | Reservoir projects can provide dispatchable electricity and, in some cases, energy storage and grid services. | New projects can have long development timelines and significant ecosystem and community impacts. Output depends on hydrology and climate conditions. |
| Geothermal | About 70–95% | 71 (2023 global weighted average) | Can deliver steady electricity and heat with a relatively small land footprint. | Resource quality is location-specific; exploration and drilling carry upfront cost and risk. Particularly suitable in geothermal regions. |
| Sustainable bioenergy | About 50–85% for dispatchable plants | 82 (2023 global weighted average) | Can be scheduled to meet demand and can use suitable residues or organic waste. | Climate benefits depend on feedstock, land-use effects, and supply-chain emissions. Best where sustainable local residues are reliably available. |
| Concentrated solar power (CSP) | About 25–60%; higher with thermal storage and suitable conditions | 117 (2023 global weighted average) | Thermal storage can shift some generation beyond sunny hours. | Needs strong direct sunlight and substantial land; generally more site-dependent than PV. Most relevant to high-irradiance regions. |
| Tidal-stream energy | Roughly 20–40% at suitable sites; project-specific | No widely comparable global average | Tidal patterns are predictable well in advance. | Commercial deployment remains limited, with challenging marine installation and maintenance. Suitable only in locations with strong tidal currents. |
| Wave energy | Site- and device-dependent; no broadly established global range | No widely comparable global average | May complement other renewables in some coastal power systems. | Technology is still at an early commercial stage; durability, marine maintenance, and cost remain important challenges. |
| Renewable-powered green hydrogen | Not directly comparable; depends on electrolyser use and renewable supply | Not directly comparable as an electricity-generation LCOE | Can store renewable energy and supply feedstock or fuel for sectors that are difficult to electrify. | It is an energy carrier, not a primary source, and conversion uses additional energy. Best assessed where direct electrification is difficult. |
Notes: Capacity factors are indicative ranges, not guarantees; actual performance depends on site, design, and operating conditions. LCOE figures for solar PV, onshore wind, offshore wind, hydropower, bioenergy, geothermal, and CSP are IRENA global weighted-average costs for newly commissioned projects in 2023, rounded to the nearest USD/MWh. They are not buyer-specific quotes and exclude the effects of financing, grid connection, storage, and local taxes. Tidal and wave projects do not yet have a widely comparable global LCOE benchmark.
Hydropower, geothermal, and ocean energy deserve serious attention from global clean-energy buyers.
Hydropower can deliver steady electricity when reservoirs, rivers, and grid connections are carefully managed. It also supports flexible generation during demand peaks.
However, dams may alter fish habitats, sediment movement, and nearby communities. A project is not truly sustainable without transparent environmental reviews and local consultation.
Geothermal energy provides reliable power and direct heat, even when sunlight or wind conditions change. Buyers should examine underground temperatures, drilling risks, water chemistry, and long-term reservoir management.
Ocean energy remains less mature, but tidal streams and wave devices offer predictable resources near suitable coastlines.
Saltwater corrosion, difficult maintenance, and storm damage still raise costs.
These technologies show promise, but promise is not performance. Real operating data matters more than attractive projections.
Tips:
Compare lifetime costs, not only installation prices. Request verified output records and independent environmental assessments. Check grid access before signing contracts. Ask who will maintain equipment after harsh weather.
Consider hybrid systems that combine hydropower, geothermal heat, and ocean generation. Local skills are essential; imported expertise alone may not last.
Buyers should also question their assumptions. A remote geothermal site may produce clean energy, yet weak transmission can make it impractical.
A small tidal project may fit the coastline better than a larger installation.
Careful site evidence should guide the purchase.
Global buyers are widening their energy portfolios beyond solar and wind. The International Energy Agency reported 585 gigawatts of renewable capacity additions in 2024. Bioenergy remains valuable where organic residues are abundant. Rice husks, forestry waste, and landfill gas can support local heat and power systems.
Sustainable bioenergy depends on strict sourcing. Buyers should request residue audits, land-use records, and lifecycle emissions data. The IEA estimates modern bioenergy supplies around 6% of global energy demand. However, this figure hides major differences between regions. Burning waste can reduce emissions, but poorly managed feedstocks may damage soil and biodiversity.
Green hydrogen offers another route for steel, shipping, and seasonal storage. The IEA’s Global Hydrogen Review 2024 reports that announced low-emissions projects could reach about 49 million tonnes annually by 2030. Yet only a small share has secured final investment decisions. That gap matters. A hydrogen contract is not automatically a clean-energy contract.
Emerging options deserve careful screening. Renewable methane, geothermal heat, ocean energy, and sustainable aviation fuels each solve different problems. IRENA data shows renewable power costs have continued falling, but infrastructure and financing still shape final prices. Buyers should compare delivered energy, not headline production costs. A remote hydrogen project may look efficient on paper. Pipelines, ports, storage tanks, and water availability can change the calculation. The market is moving quickly. Some assumptions will fail.
Indicative lifecycle greenhouse-gas emissions per kilowatt-hour of electricity. Lower values indicate lower emissions.
How to read this: Values are approximate lifecycle medians in g CO₂e/kWh, based primarily on IPCC assessments; results vary by location, technology, and supply chain. The green-hydrogen bar is an illustrative renewable-electricity-to-hydrogen-to-power scenario, not a universal value. Hydrogen is an energy carrier, so its emissions depend on how it is produced and used. Bioenergy impacts vary substantially with feedstock and land-use change.
Reference: IPCC, Fifth Assessment Report, Working Group III, Annex III (lifecycle electricity emissions); hydrogen value is an explicitly illustrative scenario.
Global buyers should compare delivered power, not headline generation costs. IRENA’s Renewable Power Generation Costs in 2023 report found that 81% of newly commissioned utility-scale renewable capacity produced electricity more cheaply than fossil-fuel alternatives.
These figures help screen projects, but they are not a full purchase price. Grid connections, storage, land, financing, and local taxes can change the economics sharply. A sunny site may still need batteries for evening demand. A windy coastal project may face costly transmission work.
Each source carries different risks. Hydropower can provide flexible output, yet drought and ecosystem impacts deserve close review. Geothermal offers steady generation, but drilling may fail or exceed budget. Biomass depends on reliable feedstock and credible emissions accounting.
The IEA’s Renewables 2024 report identifies permitting, grid capacity, and financing as constraints on deployment in many markets.
Buyers should verify resource studies, power-purchase terms, currency exposure, and supplier delivery records. Small details matter. A delayed transformer can postpone revenue for months. Comparing projects across countries is imperfect, too: subsidy rules and grid access differ, and published cost averages hide those differences. I would treat any ranking as a starting point, not a buying decision.