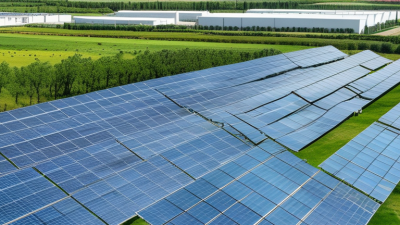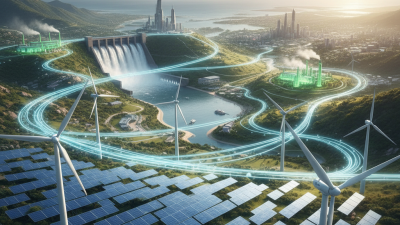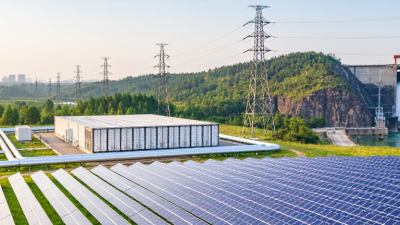
Global buyers are seeking cleaner power without sacrificing reliability, affordability, or supply-chain resilience. The market is expanding quickly. The International Energy Agency reported that clean-energy investment could reach about $2 trillion in 2024, twice the investment in fossil fuels. IRENA recorded 473 gigawatts of renewable capacity additions in 2023. Renewables represented nearly 86% of total new power capacity that year.
This article examines ten practical clean energy solutions for international procurement teams. The list includes solar photovoltaic systems, onshore and offshore wind, battery storage, hydropower, geothermal energy, bioenergy, heat pumps, green hydrogen, smart grids, and energy-efficiency technologies. Each option serves different site conditions. A warehouse roof may support rooftop solar. A remote mine may need hybrid solar and storage. A cold industrial facility may benefit more from heat pumps than hydrogen.
The numbers look impressive. Reality is less tidy. Grid connection delays, mineral supply risks, land use, financing costs, and local permitting can change project outcomes. The IEA’s Renewables 2024 report expects global renewable capacity to grow substantially through 2030, yet it also identifies grid infrastructure and policy implementation as persistent barriers. Buyers should therefore compare lifetime performance, not purchase prices alone. They should verify equipment certifications, warranty terms, degradation rates, emissions data, and supplier experience. Independent testing matters. So does local maintenance capacity.
No single technology fits every market. That caveat matters. Reliable decisions require transparent data, regional expertise, and careful risk assessment. The following clean energy solutions offer a practical starting point for buyers pursuing measurable emissions reductions and stronger long-term energy security.
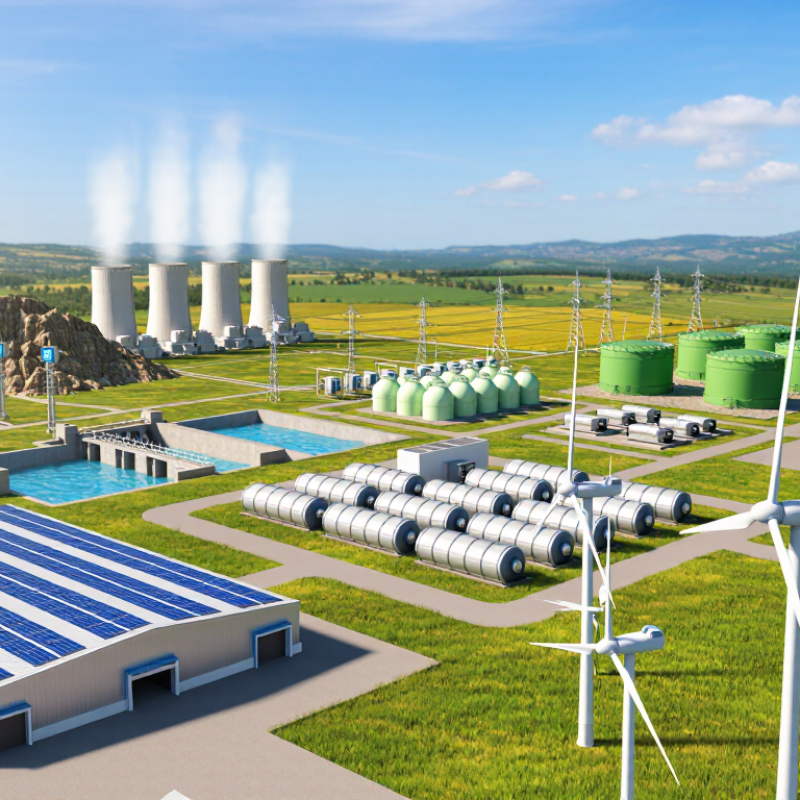
Top 10 Clean Energy Solutions for Global Buyers
Clean energy solutions are more than solar panels or wind turbines. They include technologies and services that reduce lifecycle emissions, improve energy efficiency, and support dependable power. The leading options include solar, wind, small hydro, geothermal systems, sustainably sourced bioenergy, battery storage, heat pumps, efficient buildings, smart grids, and renewable hydrogen.
Global buyers need evidence, not attractive performance claims. A project in a dry region may favor solar, while a cloudy island may require wind, storage, or hybrid generation. Grid stability, land availability, local regulations, currency risk, and skilled maintenance teams also shape the decision. Site surveys should measure sunlight, wind patterns, soil conditions, and nearby connection capacity. Small details matter.
Reliability is often overlooked. Buyers should request verified test results, safety records, component traceability, realistic production estimates, and clear maintenance procedures. Independent certification can strengthen confidence, but it does not replace local inspection. A five-year cost review should include transport, replacement parts, software, insurance, and end-of-life handling. Cheap equipment may become expensive after one failed component.
Some assumptions need revision. “Clean” does not always mean impact-free. Mining, construction, water use, and disposal still require scrutiny. Buyers can improve decisions by comparing lifecycle data, supplier experience, worker training, and after-sales response times. The strongest solution is usually not the newest one. It is the one that performs reliably in its actual climate, grid, budget, and operating conditions.
Top 10 Clean Energy Solutions for Global Buyers
The Top 10 Clean Energy Solutions by Application
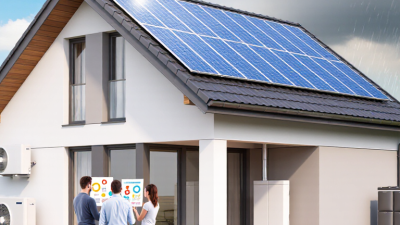
Homes often benefit from rooftop solar and battery storage. A smart inverter can shift daytime power into evening use. Heat pumps reduce fuel demand for space heating and hot water. Electric vehicle chargers work best when paired with solar generation. Small details matter, including cable length, local weather, and available connection capacity.
Commercial buildings can use rooftop solar, battery systems, and energy management software. Factories may add larger solar arrays, wind power, or waste-heat recovery. Farms can apply solar water pumps, anaerobic digesters, and efficient irrigation controls. Remote communities may need renewable microgrids with storage and backup generation. Public sites can combine solar canopies with managed EV charging.
Utility-scale projects commonly include wind farms, solar parks, and long-duration storage. Green hydrogen can support industries that are difficult to electrify, but its cost and water needs require careful review. In field assessments, buyers should compare lifetime output, maintenance access, worker training, and recycling plans. Independent testing and recognized electrical standards improve confidence. No option is perfect. A battery may lose capacity in extreme heat. Solar output changes with clouds. Hydrogen projects can appear attractive before transport costs are included. Reliable procurement therefore depends on measured local data, transparent warranties, and realistic performance assumptions.
| No. | Clean Energy Solution | Primary Application | Typical Project or Unit Scale | Typical Lifecycle GHG Emissions | Direct Operational Emissions | Key Resource or Input | Commercial Readiness | Important Buyer Considerations |
|---|---|---|---|---|---|---|---|---|
| 1 | Solar Photovoltaic Systems | Utility generation, commercial rooftops, off-grid power | 1 kW to 1+ GW | Approximately 41–48 gCO₂e/kWh | 0 gCO₂e/kWh during electricity generation | Solar irradiation, land or roof area, electrical grid connection | Commercially mature | Evaluate annual solar yield, module degradation, land use, grid capacity, recycling plans and energy-storage requirements. |
| 2 | Onshore Wind Power | Large-scale electricity generation and distributed power | 1 MW to 10+ MW per turbine | Approximately 11 gCO₂e/kWh | 0 gCO₂e/kWh during electricity generation | Consistent wind resource, suitable land, transmission access | Commercially mature | Compare wind-speed assessments, capacity factor, permitting conditions, turbine transport access, noise limits and curtailment risk. |
| 3 | Offshore Wind Power | High-volume coastal and maritime electricity supply | 8 MW to 20+ MW per turbine | Approximately 12 gCO₂e/kWh | 0 gCO₂e/kWh during electricity generation | Offshore wind resource, seabed conditions, ports and subsea cables | Commercially mature | Assess water depth, seabed surveys, offshore construction capability, cable distance, marine permits and operations access. |
| 4 | Hydropower | Dispatchable electricity, grid balancing and water infrastructure | Small systems below 10 MW to multi-GW facilities | Approximately 24 gCO₂e/kWh median; site-dependent | Typically 0 gCO₂e/kWh; reservoirs may emit methane | River flow, elevation difference, water rights and suitable topography | Commercially mature | Review hydrology, drought exposure, sediment management, ecological impacts, resettlement requirements and dam safety. |
| 5 | Geothermal Energy | Baseload electricity, district heating and industrial heat | 1 MW to 100+ MW per plant | Approximately 38 gCO₂e/kWh median; resource-dependent | Low; may vary by reservoir and plant design | Accessible high-temperature reservoirs, drilling capacity and water management | Commercially mature in suitable regions | Confirm resource temperature, drilling risk, reservoir sustainability, induced-seismicity controls and local permitting. |
| 6 | Sustainable Bioenergy and CHP | Industrial heat, combined heat and power, renewable fuels | 1 MW to 100+ MW per facility | Highly variable; feedstock and land-use dependent | Biogenic CO₂ is released during combustion; net impact depends on feedstock | Certified residues, wastes or sustainably managed biomass supply | Commercially mature for selected feedstocks | Verify feedstock traceability, indirect land-use effects, air-quality controls, transport distance and competing uses. |
| 7 | Green Hydrogen and Derivatives | Steel, chemicals, shipping fuels, refining and long-duration storage | MW-scale electrolyzers; larger hubs can reach GW scale | Potentially near-zero at production when powered by additional renewable electricity | 0 gCO₂e/kWh at the electrolyzer; downstream emissions depend on use | Renewable electricity, purified water, electrolyzer equipment and storage | Commercial; rapid scale-up phase | Check electricity additionality, water availability, hydrogen purity, compression or liquefaction needs, safety codes and offtake certainty. |
| 8 | Grid Battery Energy Storage | Peak shifting, frequency regulation, renewable integration and backup | 1 kW to 1+ GW; commonly 1–8 hours of rated duration | No generation emissions; lifecycle impact depends on chemistry and charging source | 0 gCO₂e/kWh during discharge | Electricity for charging, battery cells, thermal management and control systems | Commercially mature | Compare round-trip efficiency, cycle life, duration, degradation, fire safety, warranty terms, recycling and grid-market revenue. |
| 9 | Electric Heat Pumps | Building heating, cooling, hot water and low-temperature industrial heat | 2 kW to multi-MW thermal systems | Grid-dependent; operational emissions fall as electricity becomes cleaner | 0 gCO₂e at the point of use | Electricity, ambient air, ground source or waste heat | Commercially mature | Assess seasonal coefficient of performance, climate suitability, refrigerant type, building insulation, installer skills and peak-load effects. |
| 10 | Solar Thermal and Concentrated Solar Heat | Hot water, district heating, process heat and thermal storage | Small rooftop systems to 100+ MW thermal plants | Generally low lifecycle emissions; project-specific | 0 gCO₂e during solar heat collection | Solar irradiation, collector area, thermal storage and heat distribution network | Commercially mature for low-temperature heat | Match collector output with seasonal heat demand, evaluate storage size, operating temperature, water quality and available roof or land area. |
Data interpretation: Lifecycle greenhouse-gas figures are indicative harmonized values or ranges and can vary substantially by technology design, location, construction materials, operating conditions, supply chain and end-of-life treatment. Hydrogen and battery figures are especially dependent on the electricity source and system boundary.
Reference basis: IPCC lifecycle assessment literature, International Energy Agency technology assessments, International Renewable Energy Agency cost and technology reports, and established engineering performance ranges. Capacity figures describe common commercial configurations rather than fixed limits.
Comparing Costs, Performance, and Environmental Benefits
Global buyers should compare solar photovoltaic systems, onshore wind, offshore wind, hydropower, geothermal power, sustainable biomass, green hydrogen, battery storage, heat pumps, and efficiency upgrades. Costs vary sharply by location, financing, grid access, and project scale. According to IRENA’s Renewable Power Generation Costs in 2023, new utility-scale solar averaged about $0.044 per kilowatt-hour globally. Onshore wind averaged roughly $0.033 per kilowatt-hour. These figures are useful benchmarks, not guarantees.
Performance also depends on operating conditions. Solar output falls during cloudy hours, while wind production changes daily. Batteries improve reliability, but degradation and replacement costs remain difficult to predict. The 2024 edition of Lazard’s Levelized Cost of Energy report shows that storage economics depend heavily on duration and utilization. Heat pumps can reduce building energy use, yet cold climates may require backup systems. Green hydrogen offers industrial value, but electricity demand and electrolyzer costs remain high.
Environmental benefits need careful measurement. IPCC lifecycle assessments place median emissions near 41 grams of CO2-equivalent per kilowatt-hour for solar and 11 grams for wind. Hydropower can perform well, although reservoirs may affect ecosystems and methane emissions. Sustainable biomass is not automatically low-carbon. Supply chains matter. Buyers should request lifecycle boundaries, capacity factors, recycling plans, and verified performance data. Some published comparisons still overlook land use, mineral sourcing, or transmission losses. That gap deserves scrutiny.
Solar panels, wind systems, battery storage, heat pumps, and biogas are changing energy procurement. Geothermal, small hydro, electric vehicle charging, green hydrogen, and energy-efficiency controls also deserve attention. Yet technology alone does not prove a safe purchase. A credible supplier should provide factory records, project references, test reports, and clear warranty terms. Ask where components are made and how replacement parts will arrive. A low price can hide weak after-sales support.
Tips: Request certificates before signing. Check issuing bodies, validity dates, and product scope. Certifications for electrical safety, energy performance, environmental management, and responsible sourcing may differ by market. Verify each document independently. Do not rely on a copied PDF.
Regional rules can affect installation, grid connection, import duties, recycling, and data reporting. For example, a battery project may need fire-safety approval, transport documentation, and local grid studies. Solar equipment may face performance standards and end-of-life obligations. Requirements can change during procurement. Build a compliance checklist with local engineers and legal advisers. This step costs time, but it reduces unpleasant surprises.
Supplier assessments are rarely perfect. I have seen impressive factory presentations reveal limited field experience. A site visit helps, but it is not enough. Compare production capacity with promised delivery volumes. Review independent inspection results and actual operating data from similar climates. Keep technical assumptions visible. Humidity, dust, cold winters, and unstable grids can change performance. That detail matters more than polished sales language.
Global buyers need more than a product list when selecting clean energy solutions. Procurement should begin with load profiles, grid conditions, land limits, and local permitting timelines. Compare solar, wind, battery storage, geothermal, small hydro, and biogas against measurable needs. Also assess heat pumps, efficiency controls, green hydrogen, and renewable power contracts. Start with evidence. Request independently verified generation data, degradation assumptions, safety records, and service response times. A low purchase price can hide replacement costs, training gaps, or difficult spare-part access. Use a weighted evaluation model, and record why each supplier passed or failed.
Deployment works better when engineering, finance, operations, and community representatives share one schedule. Confirm interconnection studies before equipment arrives. Map cable routes, drainage, fire access, worker protection, and noise controls on site. Pilot a smaller system where weather or demand data remains uncertain. Plans change. Build contingency budgets for transport delays, import duties, civil works, and transformer shortages. Commissioning should include witnessed performance tests, cybersecurity checks, emergency drills, and clear acceptance criteria. Independent inspectors can challenge optimistic forecasts before payment milestones are released.
Long-term management requires more than annual reporting. Track uptime, yield, battery health, avoided emissions, maintenance costs, and complaints in a shared dashboard. Set thresholds that trigger inspections, software updates, component replacement, or contract review. Train local technicians with practical fault scenarios, not only manuals. Keep calibrated meters and dated maintenance logs. That matters. Buyers should review whether the system still fits changing tariffs, production schedules, climate risks, and waste rules. Some assumptions will prove wrong. A credible program documents those lessons and adjusts procurement standards for the next project.
Planning Procurement, Deployment, and Long-Term Management
The chart compares indicative 2024 global cost benchmarks in USD/MWh for major clean-energy procurement options. Values represent approximate midpoint estimates from publicly reported international renewable-power and storage cost ranges. Actual project costs vary by location, financing, resource quality, grid connection, permitting, and contract structure.
Lower values generally indicate stronger cost competitiveness, while long-term procurement decisions should also consider reliability, scalability, land use, storage requirements, and lifecycle management.