Global buyers are rethinking energy procurement as prices, climate risks, and grid reliability reshape business decisions. Sustainable energy solutions now include solar power, wind contracts, battery storage, green hydrogen, and efficiency systems. The right choice depends on location, demand patterns, financing, and measurable performance.
In a factory outside Madrid, rooftop panels may reduce daytime electricity purchases. A battery can store midday power for evening production. In a remote logistics hub, however, storage capacity and maintenance access may matter more than panel size. Buyers should examine equipment warranties, supply-chain traceability, land use, recycling plans, and carbon accounting. They should also request production data, not attractive promises.
Fatih Birol, Executive Director of the International Energy Agency, stated, “The clean energy transition is happening worldwide and it’s unstoppable.” He added that the key question is how fast it happens. That perspective gives this market urgency, but not permission for careless decisions. A low-carbon label does not automatically prove strong environmental performance. Some projects still face mineral constraints, transmission delays, permitting challenges, and uncertain end-of-life processes.
The following outline examines practical sustainable energy solutions for global buyers. It connects technology selection with total cost, resilience, emissions reduction, and supplier credibility. Readers will find opportunities, but also uncomfortable trade-offs. No solution fits every market. That is the point. A credible purchasing strategy should remain flexible, evidence-based, and open to correction as better data becomes available.
Sustainable energy means meeting today’s needs without weakening tomorrow’s options. It includes renewable sources such as solar, wind, hydropower, and geothermal energy. However, sustainability also depends on durability, land use, material sourcing, and end-of-life management. No technology is impact-free. A responsible assessment examines the entire life cycle, not just emissions during operation.
Its global importance is practical and immediate. Cleaner electricity can reduce air pollution near homes, factories, and transport routes. Reliable power also supports hospitals, schools, irrigation, and digital services. In remote communities, small-scale systems can reduce dependence on costly fuel deliveries. Yet access remains uneven. A solution that works in a sunny region may fail during long cloudy seasons or weak-grid conditions. Storage, maintenance skills, local financing, and fair planning matter greatly. In project reviews, overlooked maintenance often becomes the quiet reason a promising system underperforms. That deserves more attention.
Tips: Compare life-cycle emissions, expected service years, repair access, and local resource conditions. Ask for transparent performance data from independent assessments. Leave room for uncertainty. Forecasts can be wrong, especially when climate patterns and energy demand change. Buyers should also examine worker safety, responsible materials, and community consultation. The cheapest purchase price may hide replacement costs. A balanced decision values reliability, affordability, environmental protection, and long-term public benefit.
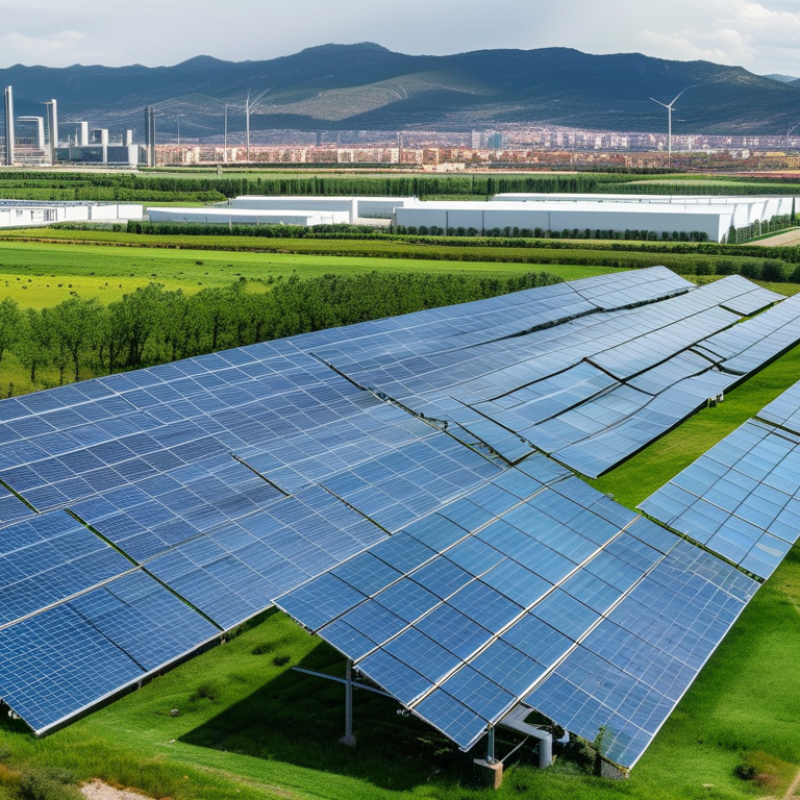
Solar and wind now dominate new renewable capacity. IRENA’s Renewable Capacity Statistics 2024 recorded 473 gigawatts of renewable additions in 2023. Solar contributed about 346 gigawatts, while wind added nearly 117 gigawatts. Solar works well on warehouses, farms, and unused land. Wind needs stronger resources and careful community planning. Output changes with weather. Storage and flexible demand remain essential.
Hydropower provides dependable electricity and valuable grid balancing. However, new dams can disturb rivers, fisheries, and local communities. The International Energy Agency expects hydropower growth to continue, but at a slower pace than solar and wind. Geothermal offers steady generation and a small land footprint. Its best sites are geographically limited. Drilling risks and exploration costs also deserve serious attention.
Bioenergy can use agricultural residues, forestry waste, and organic materials. The carbon outcome depends heavily on feedstock, land use, transport, and regrowth. The IPCC’s lifecycle assessments show that renewable technologies usually emit far less than fossil generation, but their results vary widely by project. That detail matters. A low-carbon label alone is not enough. Buyers should examine resource quality, grid connection, water use, labor practices, and end-of-life recycling. IRENA’s data is encouraging, yet deployment speed can hide weak planning. Mistakes still happen. A practical portfolio may combine steady geothermal or hydro with variable solar and wind, while treating bioenergy as a carefully verified option.
Global buyers now evaluate energy projects beyond their purchase price. Solar and wind often offer low operating costs, but their output changes with weather. A 10 MW solar site may produce strongly at noon, then deliver nothing after sunset. Equipment, land, grid connection, and maintenance can significantly change the final cost. Cheap power is not always cheap energy.
Reliability depends on the local grid and the project design. Wind farms may generate power overnight, while solar production peaks during daylight hours. Battery storage can balance these differences, but its cost rises with capacity, replacement cycles, and safety requirements. A four-hour battery cannot support a factory through several cloudy days. Not enough. Buyers should examine outage records, service access, spare parts, and performance guarantees before signing contracts.
Environmental effects also require careful measurement. Renewable systems produce little operational pollution, yet manufacturing panels, turbines, and batteries consumes minerals, water, and energy. Transporting heavy equipment across oceans adds further emissions. Independent lifecycle assessments can reveal these hidden impacts. Recycling plans matter, especially for batteries and composite turbine materials. Some projections look precise but rely on uncertain weather and price assumptions. That weakness deserves attention. A credible procurement review should test several climates, storage sizes, and grid conditions, rather than trusting one attractive forecast.
Regional conditions should guide every energy purchase. A desert project may offer intense sunlight, but it may also face dust, water scarcity, and weak transmission lines. Coastal regions need corrosion-resistant equipment and stronger storm planning. Mountain communities may benefit from small hydro, solar, and battery systems, rather than one central plant.
IRENA reported 473 gigawatts of renewable capacity added globally in 2023. Renewables represented 86% of new power capacity that year. Yet global averages can hide local problems. The IEA expects renewable capacity to reach 7,300 gigawatts by 2028, driven mainly by solar and wind.
Buyers should examine grid stability, seasonal demand, land access, financing costs, and maintenance skills. A low purchase price is not always a low lifetime cost. That lesson is easy to miss. Regional labor shortages can also delay repairs and reduce output.
Tips: Compare five-year weather data, not annual averages. Request performance records from similar climates. Check battery temperature limits and recycling plans. For remote sites, test spare-part logistics before signing contracts. The World Bank’s Energy Progress Report shows that hundreds of millions still lack reliable electricity. Therefore, affordability and service access matter as much as carbon reductions. Hybrid systems can improve resilience, but they require careful controls and trained operators. No solution fits every market. Procurement teams should document assumptions, test them locally, and revise plans when field evidence disagrees.
Top Sustainable Energy Solutions for Global Buyers
Guiding Global Buyers Through Selection and Implementation Criteria
Global buyers need more than attractive efficiency figures. They need evidence that a solution works in their operating environment. Begin with a site assessment covering sunlight, wind patterns, grid stability, soil conditions, and seasonal demand. A system designed for a coastal warehouse may fail inland without corrosion protection or dust controls. Small details matter.
Use a clear evaluation scorecard. Compare lifetime energy output, installation complexity, maintenance access, safety controls, and total ownership cost. Request independently verified performance data, product testing records, and documented service procedures. Check whether local technicians can replace key components. Also review permits, import rules, electrical standards, and waste-handling requirements before signing a contract. Compliance should be confirmed locally, not assumed from another market.
Implementation should start with a measured pilot. Track output, downtime, battery temperature, water use, or fuel reduction for several months. Record unusual weather and operator feedback. These details often challenge the original forecast. No scorecard is perfect. In my experience, buyers sometimes overvalue peak performance and undervalue training, spare parts, and response times. A practical contract should define acceptance tests, reporting intervals, maintenance duties, and remedies for missed performance targets. It should also allow controlled adjustments when site conditions differ from early surveys.
| Energy Solution | Best-Fit Use Case | Typical Project Scale | Typical Capacity Factor | Indicative Lifecycle Emissions | Main Selection Criteria | Key Implementation Requirements | Primary Risk to Assess |
|---|---|---|---|---|---|---|---|
| Utility-Scale Solar Photovoltaics | Low-cost daytime electricity, utility procurement, commercial and industrial sites | 1 MW to more than 1 GW | 12%–30%, depending on solar resource and tracking system | Approximately 20–50 gCO₂e/kWh | Solar irradiation, grid connection, land availability, module durability, energy yield, degradation rate | Land assessment, geotechnical studies, permitting, interconnection approval, construction and recycling planning | Intermittent output, curtailment, transmission constraints and extreme weather exposure |
| Onshore Wind | Large-scale renewable generation in areas with strong and consistent wind | 10 MW to more than 500 MW | 25%–45%, depending on wind regime and turbine design | Approximately 8–20 gCO₂e/kWh | Wind speed distribution, turbulence, wake effects, transport access, community acceptance, grid capacity | Wind measurement campaign, environmental and aviation reviews, road upgrades, foundation and transmission works | Permitting delays, public opposition, construction logistics and variable generation |
| Offshore Wind | High-volume renewable electricity near coastal load centers | 100 MW to several GW | 35%–60%, depending on offshore wind conditions | Approximately 10–25 gCO₂e/kWh | Water depth, seabed conditions, distance to shore, port capability, marine constraints and transmission route | Marine surveys, seabed leasing, offshore construction vessels, subsea cables and specialized maintenance planning | High capital intensity, supply-chain bottlenecks, weather downtime and marine permitting |
| Hydropower | Firm electricity, flexible generation and long-duration storage where suitable sites exist | Small systems below 10 MW to multi-gigawatt projects | 30%–60% in many systems; site-specific | Approximately 1–30 gCO₂e/kWh, with higher values possible for some reservoirs | Hydrology, elevation difference, sediment load, ecological sensitivity, water rights and social impacts | Long-term hydrological studies, dam safety reviews, resettlement planning, environmental permits and transmission access | Drought, flooding, sedimentation, ecosystem impacts and extended development timelines |
| Geothermal Energy | Firm low-carbon electricity or direct heat for industrial, district and agricultural applications | 1 MW to several hundred MW for electricity; smaller for direct heat | 70%–95% for suitable electricity projects | Approximately 10–50 gCO₂e/kWh; resource-specific | Resource temperature, permeability, drilling depth, reservoir sustainability, water chemistry and seismic conditions | Exploration drilling, reservoir modeling, injection planning, fluid management and specialized operations capability | Exploration failure, induced seismicity, mineral scaling and reservoir decline |
| Sustainable Bioenergy and Biogas | Dispatchable power, renewable heat, waste treatment and fuel production using verified residual feedstocks | 0.5 MW to more than 100 MW | 50%–85%, depending on feedstock supply and plant operation | Approximately 20–230 gCO₂e/kWh; highly dependent on feedstock and methane controls | Feedstock sustainability, transport distance, methane leakage, land-use change, air emissions and digestate management | Stable feedstock contracts, waste permits, emissions controls, gas cleanup and continuous monitoring | Feedstock shortages, leakage, competition with food or land uses and sustainability-certification requirements |
| Battery Energy Storage | Peak shifting, frequency response, renewable integration and backup for critical loads | 1 MW / 1 MWh to hundreds of MW / multiple GWh | Not usually rated by capacity factor; commonly designed for 1–4 hours of discharge | Approximately 60–200 gCO₂e/kWh of stored electricity, depending on cell chemistry, sourcing and cycling | Duration, round-trip efficiency, cycle life, degradation, safety architecture, operating temperature and warranty terms | Fire-risk assessment, thermal management, grid-code compliance, control software, replacement planning and recycling route | Thermal runaway, revenue volatility, degradation and insufficient duration during prolonged low-renewable periods |
| Green Hydrogen and Derivatives | Industrial feedstock, chemicals, refining, shipping fuels and long-duration energy storage | Pilot plants below 10 MW to projects above 100 MW of electrolyzer capacity | Depends on electricity supply; electrolyzers are commonly operated flexibly or continuously | Potentially below 1–3 kgCO₂e/kg H₂ when supplied by additional low-carbon electricity; project-specific | Electricity carbon intensity, electrolyzer efficiency, water availability, utilization rate, offtake and certification rules | Renewable power sourcing, purified water, compression, storage, transport, safety systems and verified carbon accounting | High energy cost, uncertain offtake, infrastructure gaps, water stress and evolving regulation |
| Renewable District Heating and Heat Pumps | Building heating, low-temperature industrial heat and municipal energy networks | Individual systems from 5 kW; district systems from 1 MW to more than 100 MW thermal | Not generally expressed as electrical capacity factor; seasonal utilization is site-specific | Typically lower than fossil heating when powered by low-carbon electricity; depends on grid mix and refrigerant | Seasonal coefficient of performance, source temperature, building efficiency, network temperature and refrigerant impact | Load mapping, insulation upgrades, electrical capacity, heat-source permits, pipe networks and backup capacity | Peak winter demand, retrofit complexity, refrigerant leakage and insufficient distribution capacity |