
How to Choose the Best Modern Energy Solutions?
Choosing the best modern energy solutions begins with your actual needs, not a product slogan. A family with a shaded roof and high evening use may need a different system from a business with daytime demand. Review recent utility bills, note seasonal changes, and check available roof or yard space. Small details matter.
Fatih Birol, Executive Director of the International Energy Agency, has called energy efficiency “the first fuel.” That idea is useful when comparing solar panels, heat pumps, batteries, and efficient appliances. Reduce avoidable energy use before sizing new equipment. Then compare installation costs, expected operating expenses, maintenance needs, and equipment warranties. Ask providers to explain their assumptions in writing. Clear answers build trust.
Reliability deserves equal attention. A battery may offer backup power, but its capacity, inverter, and charging conditions shape what it can support. Grid access, local weather, and repair services also affect performance. Look for qualified installers, transparent estimates, and evidence behind savings claims. No solution fits every home. Even careful projections can miss future price changes or unusual weather. That uncertainty is worth acknowledging, not hiding. A practical choice balances cost, comfort, emissions, and resilience over time. This guide will help readers compare options with useful questions, rather than promises that sound too easy.
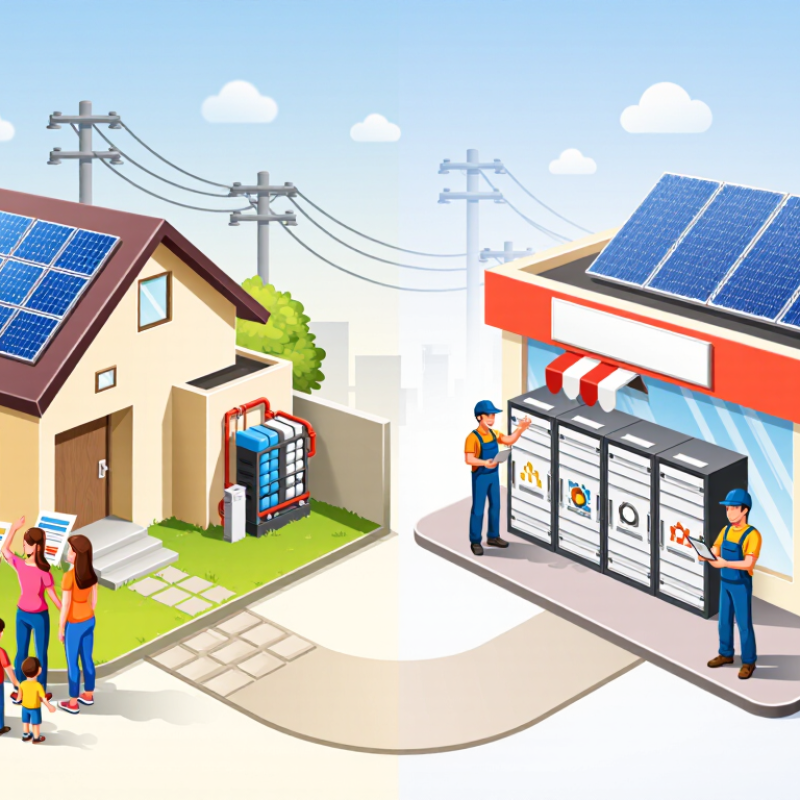
Define Energy Needs: Buildings Use About 30% of Global Final Energy (IEA)
Before comparing energy systems, measure what a building actually uses. The IEA estimates that buildings account for about 30% of global final energy consumption. That figure makes small operating assumptions matter. A drafty entrance, overheated meeting room, or empty office lit all night can quietly raise demand.
Start with utility bills, interval-meter data, and a room-by-room walkthrough. Separate heating, cooling, lighting, hot water, and plug loads where possible. The IEA’s Energy Efficiency 2023 report notes that buildings are responsible for around 30% of global energy-related emissions, underscoring the value of reducing demand before sizing new equipment. Numbers vary by reporting boundary, so record the source and period. A monthly bill alone may hide short peaks.
Then match solutions to measured loads and occupancy. A school used only on weekdays may benefit from different controls than a continuously staffed facility. Check insulation, ventilation schedules, and equipment performance during real operating hours. Small details matter. A thermostat near a sunny window can mislead. Keep a baseline, test changes, and compare energy use across similar weather periods; the first result may not tell the whole story.
How to Choose the Best Modern Energy Solutions? — Define Energy Needs: Buildings Use About 30% of Global Final Energy (IEA)
Start with measured energy use, then prioritize solutions that address the building’s largest loads. The benchmarks below are general references; actual performance depends on the building, climate, equipment, and operating patterns.
| Decision Dimension | Data or Benchmark | Potential Solution | How to Apply It | Reference |
|---|---|---|---|---|
| Building energy context | Buildings account for about 30% of global final energy consumption, according to the International Energy Agency (IEA). | Combine demand reduction, efficient equipment, and suitable clean-energy supply. | Assess the building as a whole before choosing individual technologies; prioritize the largest energy uses first. | IEA: Buildings |
| Baseline energy demand | Useful measures include annual electricity use (kWh), fuel use, peak demand (kW), and energy use intensity (kWh/m² per year). | Energy audit, submetering, and building energy-management systems. | Review at least 12 months of bills and, where possible, separate heating, cooling, lighting, and other major loads. | IEA building-energy guidance |
| Lighting efficiency | LED bulbs use at least 75% less energy and can last up to 25 times longer than incandescent lighting, according to the U.S. Department of Energy. | LED lighting, occupancy sensors, and daylight controls. | Compare lighting power, operating hours, required light levels, and control needs; calculate savings using the building’s actual schedule. | U.S. Department of Energy: LED Lighting |
| Space heating and cooling | Depending on the system and conditions, heat pumps can deliver up to three times more heat energy than the electrical energy they consume. | Air-source or ground-source heat pumps; insulation and air sealing to reduce the load. | Check local climate, existing distribution equipment, building envelope, and seasonal performance—not just the equipment’s rated efficiency. | U.S. Department of Energy: Heat Pump Systems |
| On-site solar potential | Solar output depends on local sunlight, roof orientation and tilt, shading, system size, and equipment losses. | Rooftop or site-mounted solar photovoltaic system. | Use a site-specific production estimate and compare expected annual generation with the building’s hourly and annual electricity demand. | U.S. Department of Energy: Homeowner’s Guide to Going Solar |
| Energy storage | Key comparison measures include usable capacity (kWh), maximum power (kW), round-trip efficiency, and expected cycle life. | Battery storage paired with solar, or operated to shift electricity use over time. | Match storage power and capacity to the intended purpose, such as backup, demand management, or shifting solar generation; assess costs and local rules. | Compare technical specifications and independent, site-specific economic analysis. |
| Controls and operating schedule | Energy use varies with occupancy, operating hours, weather, and control settings. | Programmable thermostats, building automation, and equipment scheduling. | Use schedules that reflect actual occupancy and verify results by comparing energy use before and after changes while accounting for weather and operating conditions. | Measure performance using utility bills or interval-meter data. |
| Project selection | Compare upfront cost, annual energy savings, maintenance, emissions, service life, and resilience benefits. | Prioritize a portfolio of efficiency upgrades and energy-supply options. | Evaluate options using consistent assumptions and local energy prices; include installation constraints, incentives, and expected equipment replacement needs. | Use local tariffs, site assessments, and transparent project quotations. |
Related Posts
-

What Are the Top Types of Energy Systems in 2026?
-
2026 Best Sustainable Energy Systems for Global Buyers
-
Top 10 Energy Storage Solutions to Maximize Efficiency and Sustainability
-
How to Choose the Right Energy Storage System?
-
2026 Best Energy Transition Solutions for Global Buyers?
-

2025 Top Digital Trends Transforming the Energy Industry: Key Insights & Data